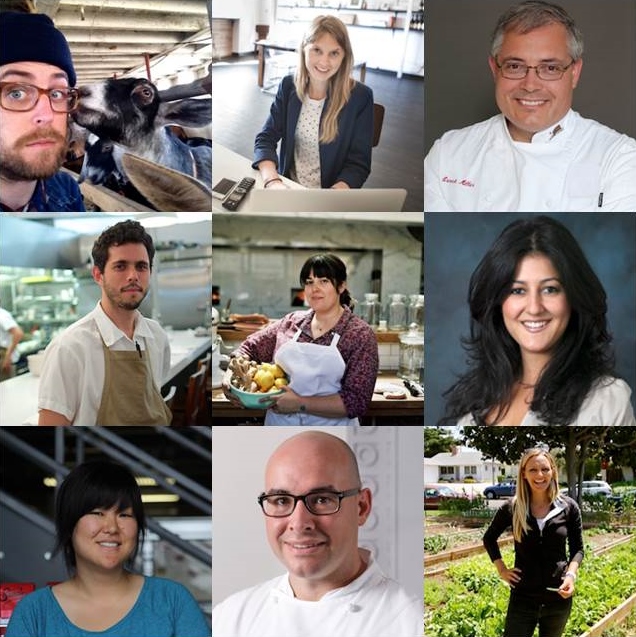
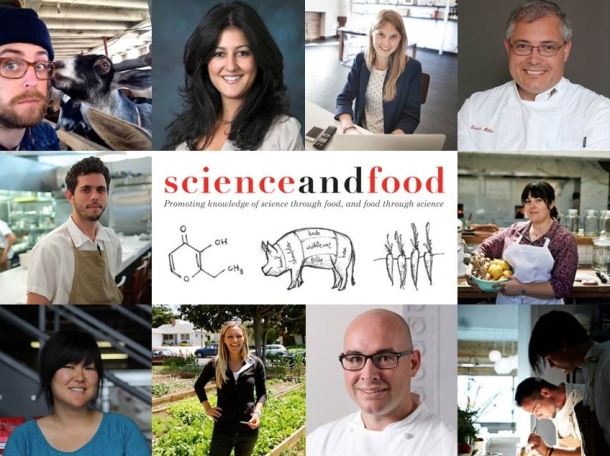
This week marks the beginning of UCLA’s Spring Quarter, which can only mean one thing… It’s time for the Science & Food undergraduate course! We have a stellar lineup of chefs and farmers slated for our third annual offering of Science & Food: The Physical and Molecular Origins of What We Eat. Although the course is only open to current UCLA students, we will be posting highlights from the course right here on the blog. Until then, check out this year’s course speakers and brush up on some of the great science we’ve learned in past courses.
And don’t forget: the Science & Food 2014 Public Lecture Series is fast approaching, so be sure to get your tickets before they sell out. Hope to see you all there!
2014 Science & Food Course Lecturers
The Molecules of Food
Eve Lahijani, UCLA School of Public Health
Why Carrots Taste Sweeter in the Winter
Ashleigh Parsons, alma
Ari Taymor, alma
Brian D. Maynard, alma
Courtney Guerra, Courtney Guerra Farms
Molecules from Soil to Plants
Ernest Miller, Master Food Preservers of Los Angeles County
Self-Assembly: From Proteins and Lipids to Cheese
Ole Mouritsen, University of Southern Denmark
Apple Pie 101
Daryl Ansel, UCLA Dining Services
Why Lettuce is Crispy
Andrea Crawford, Kenter Canyon Farms
Meat Texture and Elasticity
Ari Rosenson, CUT
Viscosity: From Physiology to Pie Filling
Nicole Rucker, Gjelina Take Away
Microbes in Food
Alex Brown, Gourmet Imports
The Physiology of Taste
Juliet Han, Espresso Republic
In the not-so-distant future, surfing the web at 35,000 feet will be just as reliable as going online at your favorite coffee shop. Who do we thank for this aeronautical innovation? Teams of engineers have been leading the charge to bring us quality in-flight internet, but there’s another WiFi hero you probably didn’t expect… potatoes!
Providing strong and consistent WiFi throughout a crowded airplane cabin presents an interesting challenge. Because the human body can interfere with WiFi signals, a cabin full of passengers can wreak havoc on an otherwise stable internet connection. But running rigorous WiFi tests on a full, airborne flight is impractical. And holding passengers hostage for days in a grounded airplane cabin is just unthinkable.
Enter the potato. Potatoes and humans have comparable dielectric properties, meaning that they similarly interact (and interfere) with WiFi signals. Engineers at Boeing used this to their advantage, creating a new way to test the quality of airline WiFi sans humans. The aptly named “project SPUDS” (Synthetic Personnel Using Dielectric Substitution) used 20,000 pounds of potatoes to quickly optimize the effectiveness and safety of WiFi signals aboard decommissioned airplanes.
When this breakthrough hit newsstands back in 2012, Boeing made it clear that potatoes weren’t in their original plan. In reality, SPUDS serendipitously took off when the research team stumbled across a paper from the Journal of Food Science describing the dielectric properties of 15 fruits and vegetables.
It turns out that food scientists have been studying the dielectric properties of fruits and vegetables for quitesome time, as these properties determine how foods behave in a microwave oven. Dielectric properties describe how materials interact with electromagnetic waves, including those emitted by microwave ovens. In particular, dielectric properties determine how much energy a food can absorb in a microwave oven and how far into the food the microwaves will penetrate. Such information is especially useful to industrial food processors who often use microwaves to cook, pasteurize, dry, or preserve various food products.
WiFi signals are typically transmitted at a frequency (2.40 GHz) that is remarkably close to the frequency produced by microwave ovens (2.45 GHz). Thanks to the work of food science researchers, Boeing engineers could confidently choose the potato as their ideal human stand-in.
Thinking about this story, it’s hard not to marvel at the interconnectedness of science. Those food scientists probably never imagined that their work would eventually help improve internet access. And those Boeing engineers must have been pretty surprised to find themselves perusing the latest in food science research. It can be difficult to predict where our ongoing pursuit of knowledge will lead us, but one thing is clear—when it comes to expanding our view of science and making new connections, the sky’s the limit.
About the author: Liz Roth-Johnson is a Ph.D. candidate in Molecular Biology at UCLA. If she’s not in the lab, you can usually find her experimenting in the kitchen.
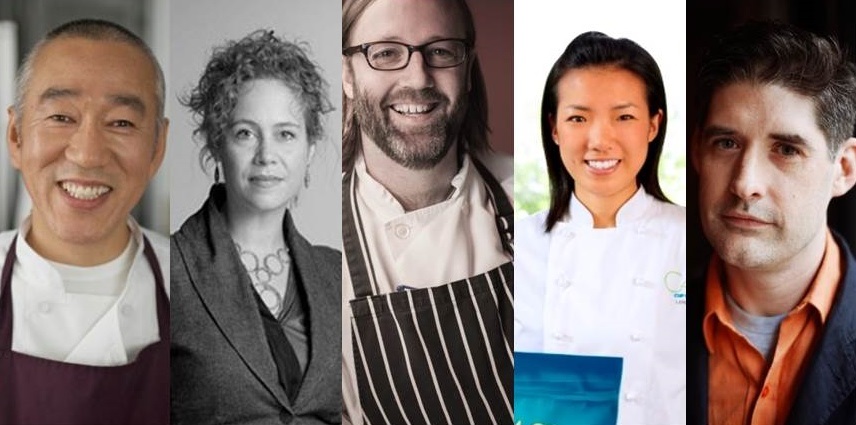
The 2014 UCLA Science & Food public lecture series is here!
General admission tickets are available for $25 from the UCLA Central Ticket Office (CTO) . Tickets can be purchased from the UCLA CTO over the phone or in person and will not include additional fees or surcharges. The UCLA CTO is located on-campus and is open Monday–Friday, 10am –4pm. A UCLA CTO representative can be reached during these hours at 310-825-2101. Tickets can also be purchased online from Ticketmaster for $25 plus additional fees. A limited number of $5 student tickets are available to current UCLA students. These must be purchased in person at the UCLA CTO with a valid Bruin Card.
The Science of Sushi Dr. Ole Mouritsen & Chef Morihiro Onodera Wednesday April 23, 2014 at 7:00pm
Schoenberg Hall, UCLA
In this lecture, Dr. Ole Mouritsen will illuminate the science underlying sashimi, nori, sushi rice, umami, and more. He will be joined by Chef Morihiro Onodera who will share his approach to sushi as well as an inside look into his partnership with a rice farm in Uruguay.
How We Taste Dr. Dana Small, Chef Wylie Dufresne, & Peter Meehan Wednesday May 14, 2014 at 7:00pm
Schoenberg Hall, UCLA
In this lecture, we will explore how we taste from the perspectives of a scientist, a chef, and a food writer. Dr. Dana Small will describe how our brains respond to flavors, and shed light on the link to obesity. She will be joined by Chef Wylie Dufresne who will present his creative approach to generating surprising food flavors and textures. Peter Meehan will share his experiences with food and taste and how they have shaped his writing, both as a cookbook author and former writer for The New York Times.
At this event, Dave Arnold will discuss his latest culinary innovations and the role of creativity in food. He will be joined by Chef Lena Kwak who will share her process of invention, research, and discovery in the kitchen. Also at this event, students of the Science & Food course will present the results of their apple pie projects, including their freshly baked pies in a large-scale pie tasting. The event will close with an Iron-Chef style discussion of the winning pies featuring the keynote speakers and renowned judges from the Los Angeles community.
https://www.scienceandfood.org/wp-content/uploads/sites/123/2014/03/2014lineupshort.jpg425856Grant Alkinhttps://sites.lifesci.ucla.edu/ibp-scienceandfoodnew/wp-content/uploads/sites/123/2016/09/newlogoSm-2-300x31.pngGrant Alkin2014-03-12 10:00:362014-03-12 10:00:36Science & Food UCLA 2014 Public Lecture Series
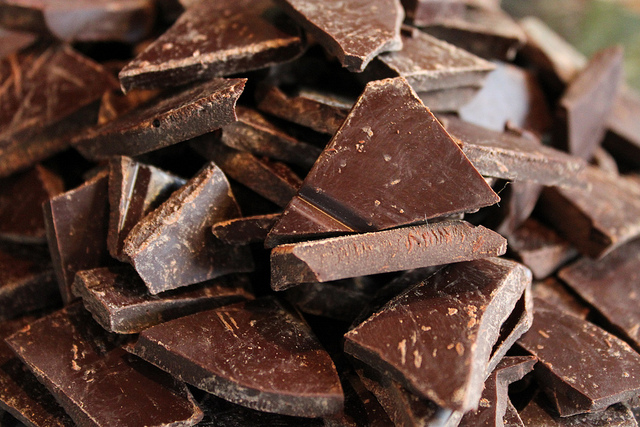
There are few things sweeter in life than chocolate, which is probably why it’s one of the most popular flavors in the world. We can thank the cacao trees (Theobroma cacao) for this gift, which are only grown within a region known as the Cocoa Belt, 10° to 20° north and south of the equator [1]. Chocolate is produced from the seeds of the pods that grow from the cacao trees; these seeds are better known as cocoa beans.
Chocolate is a complex flavor, containing over 200 different flavor compounds [3]. While the type and mixture of cocoa beans that go into a chocolate bar play a role in determining the final flavor, chocolate is the kind of food where its taste is influenced by how it’s made rather than what it’s made of [4]. The chocolate-making process varies among types of chocolate (milk, dark, bittersweet, etc.), but also depends on the style of the chocolate maker. So while the general principles and chemical processes at each step remain the same, chocolate-making is a delicious art form.
Straight off the trees, cocoa beans are bitter. When cacao pods are harvested, they are cracked open and left to sit for a couple of days, depending on the tree varietal. (5–6 days for forastero versus 1-3 days for criollo [2].) This allows the cocoa beans to undergo fermentation, a process that is carried out by naturally occurring yeast and bacteria. During fermentation, the microorganisms digest the pulp in the pods, which aids in converting the sugars in cocoa beans into acids. These acids decrease the overall bitterness of the beans. Notable flavor compounds, such as pyrazines, are also generated during fermentation, making the beans slightly more floral in aroma [2]. After fermentation, the beans are scraped from the pods to dry. Drying releases certain molecules from the beans that would otherwise make chocolate taste smoky and sour [2].
The dried cocoa beans now taste nutty, bitter, and acidic; to drive out volatile (easily evaporating) acidic molecules, the dried beans are further processed by roasting. The elevated temperatures of roasting (120–150°C) also facilitate Maillard reactions that yield flavor molecules that are distinct to chocolate [2]. These reactions are sensitive to both temperature and pH, so both the roasting temperature and bean acidity contribute to the final composition of flavor molecules that form during these Maillard reactions. Typically, milk and certain dark chocolates are made from beans that have been roasted at lower temperatures [2]. The shells of roasted beans are then removed, leaving behind pieces called cocoa nibs. Depending on the chocolate-maker, cocoa nibs may undergo alkalization, whereby they are treated with an alkaline solution in order to further decrease their acidity. Alkalization also causes flavonoids to polymerize (link together), which reduces the astringency of the nibs [2].
The final phase in chocolate manufacturing is a two-step process known as conching. At this stage, the nibs have a gritty texture; the first step in conching turns this into a paste through grinding and heating. Acidic compounds and water are evaporated in this process. More importantly, many flavor compounds formed during fermentation and roasting that are responsible for astringent and acidic notes become oxidized during conching, which mellows the flavor of the final product [2]. In the second step, cocoa butter and soy lecithin are added, decreasing the viscosity of the chocolate mixture to make it flow more easily.
Cocoa beans go through quite a long journey, from the cacao tree to the candy wrapper, where each step plays a role in producing the final combination of flavor molecules that makes chocolate such a beloved treat. This is just one of many reasons to savor your next taste of chocolate.
References Cited
“Cacaoweb.” About the Cacao Tree and Cacao Varieties. <http://www.cacaoweb.net/cacao-tree.html>.
Afoakwa EO, Paterson A, Fowler M, Ryan A. Flavor Formation and Character in Cocoa and Chocolate: A Critical Review. Critical Reviews in Food Science and Nutrition. October 2008; 48(9): 840-857, DOI: 10.1080/10408390701719272.
Schieberle, P. and Pfnuer, P. Characterization of Key Odorants in Chocolate. Flavor Chemistry: 30 Years of Progress. 1999: 147–153, DOI: 10.1007/978-1-4615-4693-1_13.
Ziegleder G, Biehl B. Analysis of Cocoa Flavour Components and Precursors. Analysis of Nonalcoholic Beverages: Modern Methods of Plant Analysis. 1988; 8: 321-393.
About the author: Alice Phung once had her sights set on an English degree, but eventually switched over to chemistry and hasn’t looked back since.
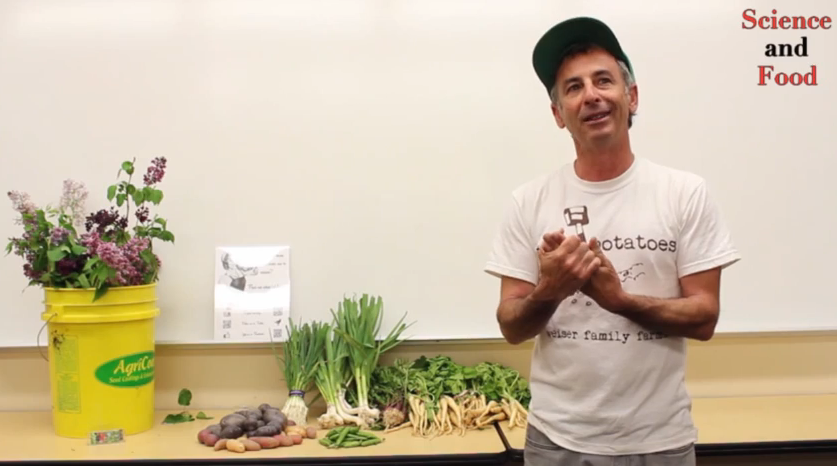
Local grower Alex Weiser stopped by the 2013 Science & Food course discuss all things potatoes and parsnips. We heard all about Weiser’s experimental plant varieties (Laker Baker, anyone?) and even learned why parsnips always taste just a little bit better in the winter. Check out the highlights:
About the author: Vince C Reyes earned his Ph.D. in Civil Engineering at UCLA. Vince loves to explore the deliciousness of all things edible.
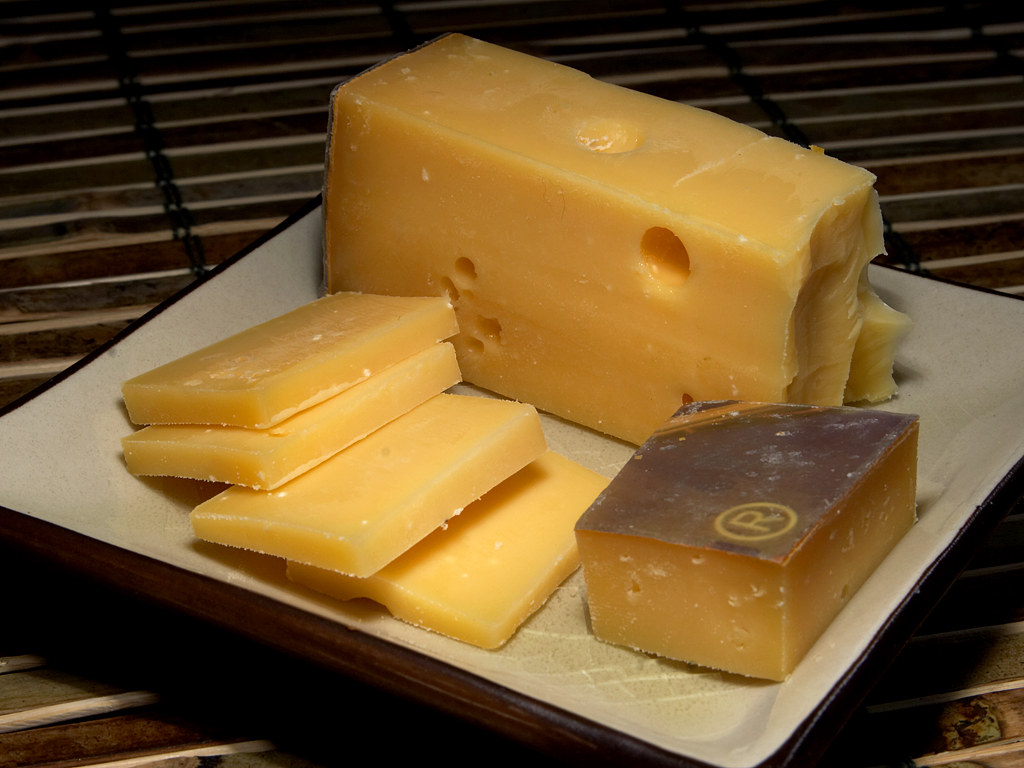
Given the popularity of cheese and the seeming ubiquitous goal towards eating less fat, it is no surprise that reduced- and low-fat cheeses have great market potential. Though as many cheese companies have discovered, reducing the amount of fat for the sake of fewer calories sacrifices that rich, bold, creamy flavor of cheese. Fat is a major contributor to taste and mouthfeel of foods, and many cheeses are considered high-fat foods. But how exactly does fat content influence cheese taste and texture?
In cheesemaking, the process of converting milk to cheese alters the structure and composition of milk, essentially reducing it to a concentrated form of milk fat and casein, a major milk protein. Casein forms a protein matrix that traps fat and water, giving cheese that soft, moist texture we expect [1]. Full-fat cheeses typically have a casein-to-fat ratio of less than one, meaning there is a higher concentration of fat compared to casein in the cheese. Because fat is a nonpolar biomolecule, the greater fat content, locked within the casein network, gives rise to a predominantly nonpolar cheese matrix.
By definition, reduced-fat cheeses have at least 25% less fat than their full-fat counterparts and low-fat cheeses have 3g of fat or less per serving (21 Code of Federal Regulations [101.62b]), which is roughly around an 80% reduction or greater, depending on the type of cheese. To accomplish this, lower fat milks, such as skim milk, are used to produce the lower fat variants, which have a casein-to-fat ratio greater than one [1,2]. With less fat, the casein networks form a tighter matrix that gives rise to firmer cheese [1]. To replace the fats removed from the cheese matrix and to soften the texture, water is typically added back into the cheeses [2]. Water is a polar molecule, so by increasing the moisture this way, the cheese matrices of reduced- and low-fat cheeses are more polar, unlike the nonpolar matrices of the full-fat cheeses.
Comparing the casein-to-fat ratios of different cheeses gives insight into more than simply cheese composition—the ratios signify how we taste the cheese. When a piece of cheese is ingested, it increases in temperature in our mouth and dissolves with saliva, transforming from a semisolid to a liquid. In addition to textural changes, aromatic flavor compounds are also released during this phase change [3]. The rate at which these compounds are released is determined by their partition coefficient, which is the concentration of the aromatic compound in its gas form compared to its concentration in its liquid form [3]. Whether the flavor compound is in a polar versus a nonpolar matrix can influence the partition coefficient, altering the timing of their release and ultimately, our sensory perception of the flavor [3]. Many flavor compounds found in cheeses happen to be fat-soluble, meaning they can mix with other nonpolar substances without separating into two layers. Considering that lower fat cheeses have prevalently polar matrices, the way the flavor compounds interact with the cheese matrices differs significantly enough to change flavor-release patterns. This is what causes some reduced- and low-fat cheeses to taste “off” compared to full-fat cheeses.
Fat reduction also modifies the cheese biochemistry. Through analysis of full-fat cheese versus 75% reduced-fat cheese, it was found that different sets of flavor compounds are critical for the cheesy flavor of the two types of cheese [3]. When certain flavor compounds characteristic of full-fat aged cheddar were added to reduced-fat young cheddar, tasters scored the two cheeses similarly [3]. So take heart, cheese-lovers. Reduced-fat cheeses certainly do have the potential to be healthy and delicious.
References Cited
Banks, J. M. (2004). The Technology of Low-Fat Cheese Manufacture. International Journal of Dairy Technology, 57(4), 199-207. doi:10.1111/j.1471-0307.2004.00136.x
Impact of Fat Reduction on Flavor and Flavor Chemistry of Cheddar Cheeses. (2010). Journal of Dairy Science, 93(11), 5069-5081. doi:10.3168/jds.2010-3346
Kim, M. K., Drake, S. L., & Drake, M. A. (2011). Evaluation of Key Flavor Compounds in Reduced- and Full-Fat Cheddar Cheeses Using Sensory Studies on Model Systems. Journal of Sensory Studies, 26(4), 278-290. doi:10.1111/j.1745-459X.2011.00343.x
About the author: Alice Phung once had her sights set on an English degree, but eventually switched over to chemistry and hasn’t looked back since.
Veterinarian and goat cheese expert Dan Drake introduced UCLA students to the science of cheesemaking as part of our 2013 Science and Food course. Did you know that good cheese starts with healthy, happy goats? Check out the highlights:
About the author: Vince C Reyes earned his Ph.D. in Civil Engineering at UCLA. Vince loves to explore the deliciousness of all things edible.
https://www.scienceandfood.org/wp-content/uploads/sites/123/2014/01/dandrakelecture.png465770Grant Alkinhttps://sites.lifesci.ucla.edu/ibp-scienceandfoodnew/wp-content/uploads/sites/123/2016/09/newlogoSm-2-300x31.pngGrant Alkin2014-01-28 10:00:362014-01-28 10:00:36Milk: From Breast to Cheese with Dan Drake
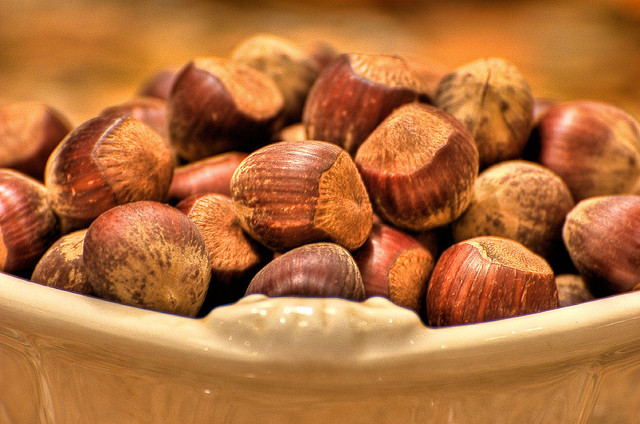
Hazelnuts may not be as popular as other nuts in the U.S., but they have quite the culinary versatility, enjoyed in pralines, Nutella, and even as themselves. These nuts grow on hazel trees, of the genus Corylus. Depending on the plant species and nut shape, hazelnut also refers to the filbert nut or cobnut. Filbert nuts have an elongated shape that tapers into a “beak”, and are found on the Filbert (C. maxima), Colchican Filbert (C. colchica), and Turkish Hazel (C. colurna). Cobnuts are generally rounder, and grow on the American Hazelnut (C. americana) and the more commercially recognized Common Hazel (C. avellana) [1].
Whether in the form of a nut, essence, or oil, hazelnuts owe their sweet, buttery flavor profile to the molecule filbertone. Interestingly, filbertone can be used to test for the authenticity of olive oil. Olive oils are sometimes cheapened by mixing in hazelnut oil [2]. As filbertone is one of the components of hazelnut oil, testing for its presence can determine whether or not a sample of olive oil is impure [3]. Although hazelnut oil is less expensive compared to olive oil, it has a strong, robust flavor that makes it a great substitute in salad dressings and baked goods.
Like many nuts, hazelnuts are a good source of protein and monounsaturated fats. Further, they contain a significant amount of thiamine, various B vitamins, and especially vitamin E [4]. Need another reason to try out hazelnuts this month? The warm, rich, velvety taste of roasted hazelnuts in decadent truffles or comforting lattes has a way of slowing down time. Try it for yourself.
Arlorio M.; Coisson JD; Bordiga M.; Garino C.; et al. “Olive Oil Adulterated with Hazelnut Oils: Simulation to Identify Possible Risks to Allergic Consumers.” Food Addit Contam Part A Chem Anal Control Expo Risk Assess. 2010 Jan; 27(1):11-8. doi: 10.1080/02652030903225799.
Flores, G.; Ruiz del Castillo, M.L.; Blanch, G.P.; Herraiz, M. “Detection of the Adulteration of Olive Oils by Solid Phase Microextraction and Multidimensional Gas Chromatography”. Food Chemistry, 2006 Jul; 97(2): 336–342.
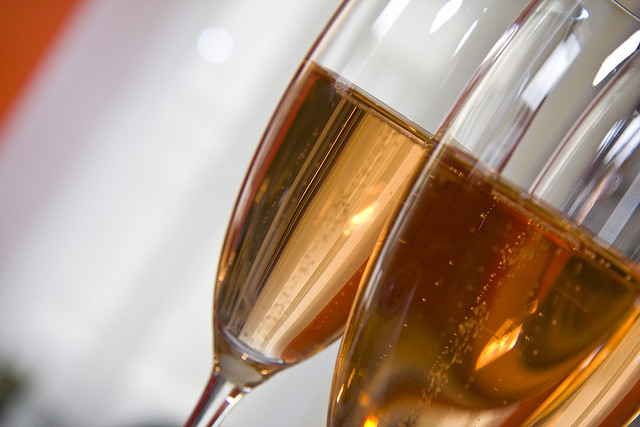
Toast the new year with a bottle of champagne! With its effervescent fizz, golden sparkle, and showy corking, it is the go-to celebratory drink. Read up on champagne making, bubble formation, and the mathematics behind bubble patterns, and get ready to show off some foodie knowledge at this winter’s new year’s party.
How It’s Made
A sparkling wine isn’t champagne unless it comes from its namesake region of France. The Champagne province in the northeast of France boasts ideal soil conditions which contribute to the grape quality, and thus the quality of the beverage that results from champagne winemaking.
Champagne undergoes a two-part fermentation process. The first fermentation results in a flat champagne wine. Next, yeast and sugar are added to this base, and the bottle is sealed. The yeast consume the sugar and produce alcohol along with about 10 grams of CO2 per liter of fluid [1].
Toward the end of production the bottle is opened, whereupon the yeast and about 80% of the CO2 are expelled from the bottle. It may seem that allowing such a large fraction of the CO2 to escape would be undoing the yeast’s hard work, but the remaining 20% in the fluid are enough to make 20 million bubbles in one champagne flute, each no larger than a millimeter in diameter [1]. The bottle is quickly corked once again, and is then ready to be sold.
The Pop
Photo credit: BitHead/Flickr
At 11:59 on December 31st, many will have a bottle in hand and will be anticipating the bang of the cork shooting out; this is caused by the buildup of pressure inside the bottle. Surprisingly, only 5% of the energy exerted during the bottle opening is the cork’s kinetic energy, that is, the energy of motion that would propel the cork into your uncle’s eye. The remaining 95% of the energy generates the popping sound’s shock wave. This wave causes a mushroom cloud-like pattern of CO2 that is released when the cork pops [3]. The white fog that rises from the bottle after the mushroom cloud is a mist of ethanol and water vapor, triggered by the sudden drop in gas temperature when the bottle pressure is rapidly released Because of the speed at which this occurs, there is no time for the energy transfer—heating—to occur. The result is adiabatic cooling. The gas temperature drops, causing the water vapor in the gas to condense [3].
The Bubbles
Natural Effervescence — Champagne fizz has a rather surprising source. It is caused by the presence of tiny cellulose fibers that cling to the glass by electrostatic forces. The fibers are deposited from the air or that have been left over after wiping the glass with a towel. Each fiber, about 100 micrometers long, develops an internal gas pocket as the glass is filled. These microfiber gas pockets are the bubble formation sites. To form a bubble, dissolved CO2 has to push through liquid molecules held together by very weak but abundant molecular interactions. The CO2 would not have enough energy to do this on its own, but the gas pockets held in the cellulose fibers lower the energy barrier and allow a bubble to form. CO2 continually deposits itself from the champagne into the bubble until it reaches about 10-50 micrometers [1], whereupon its buoyant force is so great that it detaches from the fiber and floats upward. A new bubble forms immediately in its place.
Artificial Nucleation — Because natural effervescence is very random and not easily controlled, glassmakers use a more reproducible way to generate bubbles. Glassmakers use a laser to engrave artificial nucleation sites at the bottom of the glass to make the effervescence pattern pleasing to the eye. They usually create no fewer than 20 scratches to create a ring shape, which produces a consistent column of rising bubbles.
Bubble Patterns
Bubbling patterns actually change over the time that the champagne is within the glass. The bubbles start out as strings that rise in pairs, then gradually transition to bubbles in groups of threes, and finally settle down in a clockwork pattern of regularly spaced individual bubbles. A team of physicists in the Champagne region of France have performed extensive research to figure out the science behind champagne fizz and the interesting patterns the bubble strings form.
The patterns are determined by the vibration rate of the gas trapped at the nucleation point and the growth rate of the bubbles outside. These factors are determined by atmospheric pressure on the surface of the champagne, temperature, and the size of the nucleation point in the glass, among other factors. The Champagne team has arrived upon a complex equation to explain the differential patterns of bubble streams by relating bubble radius, oscillation frequency of the gas pocket, and the time interval between two successive bubbles [2]
R(Ti + 1) = Ro + Ecos(2πωFbTi + 1)
where Ro is the radius of the bubble just before release, and Ti is the time interval between two successive bubbles, ω is the ratio between the oscillation frequencies of the gas pocket and the bubble (Fb), and E is related to the interactions between the two systems [2].
Now that some of the mystery behind the sparkle and pop of champagne has been explained through science, opportunities to impress friends and strike up conversation present themselves at the next big occasion. Break out a timer and graph paper; observe one nucleation point on a glass and measure the transition time from two to three bubble patterns. Someone is bound to ask what the stop watch is for.
References
“Bubbles and Flow Patterns in Champagne.” American Scientist. N.p., n.d. Web. 19 Dec. 2013.
Liger-Belair, Gerard. “Period Adding Route in Sparkling Bubbles.” Physical Review 72 (2005): n. pag. Web.
About the author: Elsbeth Sites is pursuing her B.S. in Biology at UCLA. Her addiction to the Food Network has developed into a love of learning about the science behind food.
Photo credit: Lisa Bunchofpants (bunchofpants/Flickr)
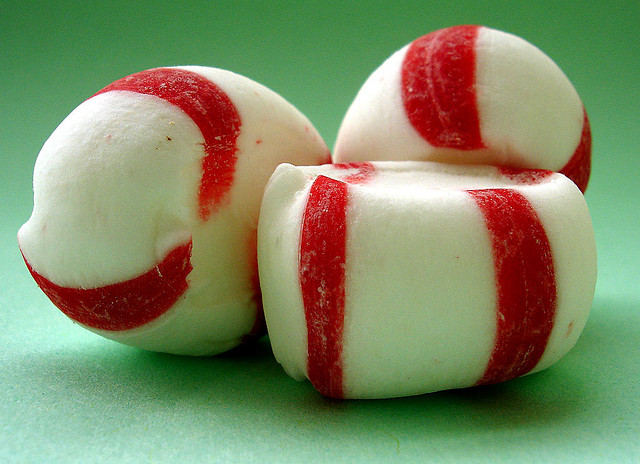
Seasonal winter treats somehow seem incomplete unless they are imbued with a frosty, peppermint flavor. This is easily accomplished by enhancing the recipe with peppermint oil or peppermint extract, cultivated from the leaves of the peppermint plant. This plant’s scientific name is Mentha x piperita, the “x” indicating that it is a hybrid mint, formed by crossing watermint (Mentha aquatica)and spearmint (Mentha spicata). As a hybrid plant, peppermint is sterile, unable to produce seeds. Instead, it reproduces via rhizomes, bulbous plant masses found underground that are very similar to ginger and turmeric roots. Like many rhizomes, peppermint rhizomes can be planted almost anywhere, growing quickly once sprouted. For this reason, the peppermint plant is listed as invasive in Australia, the Galapagos Islands, New Zealand, and the Great Lakes region of the U.S. [1].
Peppermint oils and extracts get their characteristic Christmas-in-your-mouth flavor from their two main constituents, menthol and menthone. Of the two, menthol may be the more recognizable: When ingested, applied topically, or inhaled, menthol triggers cold-response sensory receptors, which cause that familiar cooling sensation [2]. You may have experienced this from chewing minty gums, using toothpaste, or applying Bengay to sore muscles.
Menthone is structurally related to menthol, but it affects a different sense in peppermint-flavored treats. This molecule gives rise to the icy, minty scent reminiscent of evergreen winters. Its distinctive fragrant property makes it popular in perfumes, cosmetics, and scented oils.
If you indulge in something peppermint this month, take some time to appreciate the menthol and menthone that makes this essence a holiday classic. Feel the sharp chill in your mouth while you bask in the warmth of a heated room. Take in the scent of cool mint while the winter wind outside whirls away. ‘Tis the season.
References Cited
Pacific Island Ecosystems at Risk: Mentha x piperita <http://www.hear.org/pier/species/mentha_x_piperita.htm>.
Knowlton, Wendy M., et al. “A Sensory-Labeled Line For Cold: TRPM8-Expressing Sensory Neurons Define The Cellular Basis For Cold, Cold Pain, And Cooling-Mediated Analgesia.” Journal Of Neuroscience 33.7 (2013): 2837-2848. Academic Search Complete. Web. 23 Nov. 2013.
About the author: Alice Phung once had her sights set on an English degree, but eventually switched over to chemistry and hasn’t looked back since.


