
The Science of Steamed Milk: Understanding Your Latte Art
Guest post by Christina Jayson
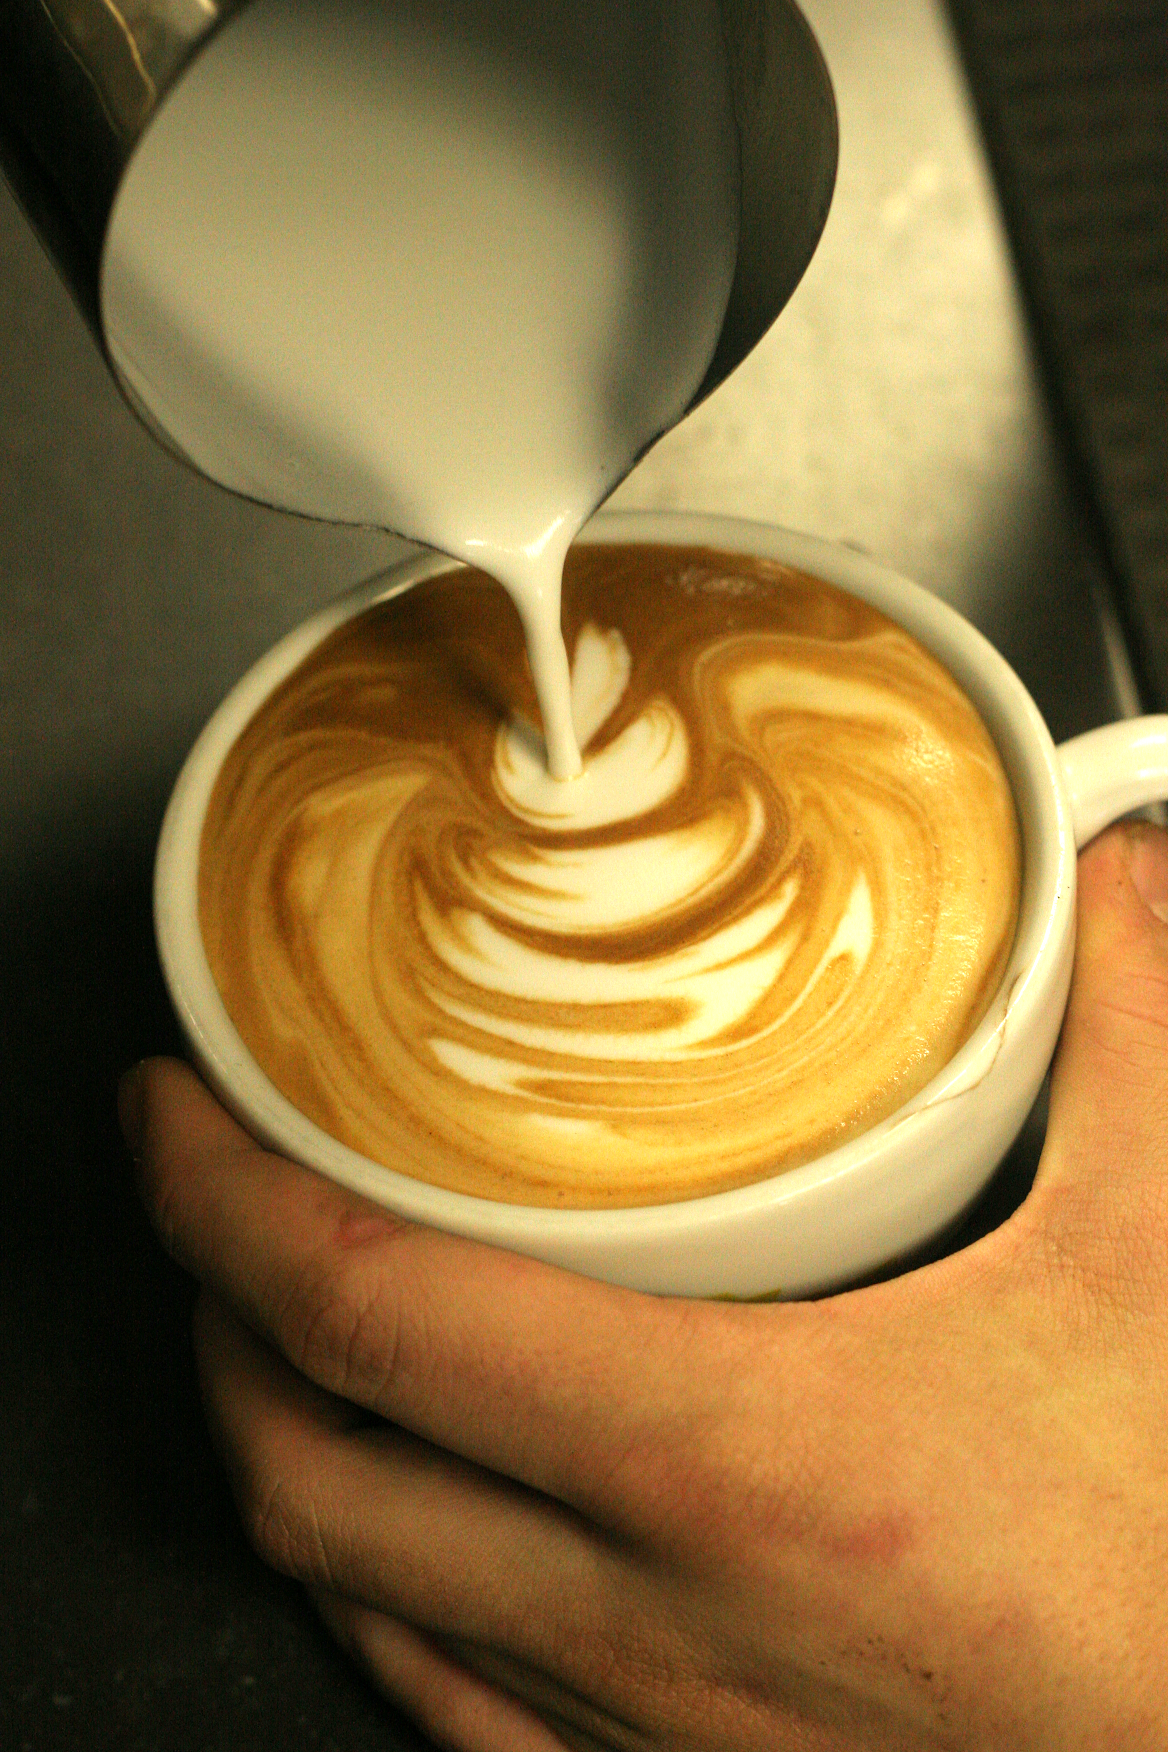
Photo credit: Dan Lacher (journeyscoffee/Flickr)
Watch a barista at work and you will observe the art of preparing a perfect café au lait, cappuccino, macchiato, or mocha – all of which involve different quantities of steamed milk. Behind the artistic foam hearts and milk mustaches lies a science to steamed milk.
Students of UCLA’s SPINLab (Simulated Planetary Interiors Lab) team developed an app that allows you to “calculate the power output of your steamer” and predict the “steaming time for optimal milk temperature based on amount, type and starting temperature of your milk”. Samuel May of SPINlab explains the calculations the app takes into account that allows it to predict the temperature of milk at a given time. They show that the temperature increase of milk over time is linear, allowing them to make these predictions based on a Linear Heating Model.
But what exactly happens when you steam milk? Steaming involves introducing hot water vapor (T = 250-255 °F) into cold milk (T = 40 °F) until it reaches the ideal temperature for a “perfectly steamed latte.”
While the process sounds simple enough there are a host of variables that need to be considered. Most importantly, different milks require different amounts of steaming time. As SPINLab expert, Sam warned, too high a temperature can scald the milk: scalding kills bacteria and denatures enzymes; this inactivates the enzymes and causes curdling as denatured milk proteins clump together. Since different types of milk and dairy alternatives have different molecular compositions, this means they have different steaming temperatures. This difference all boils down to the composition of milk.
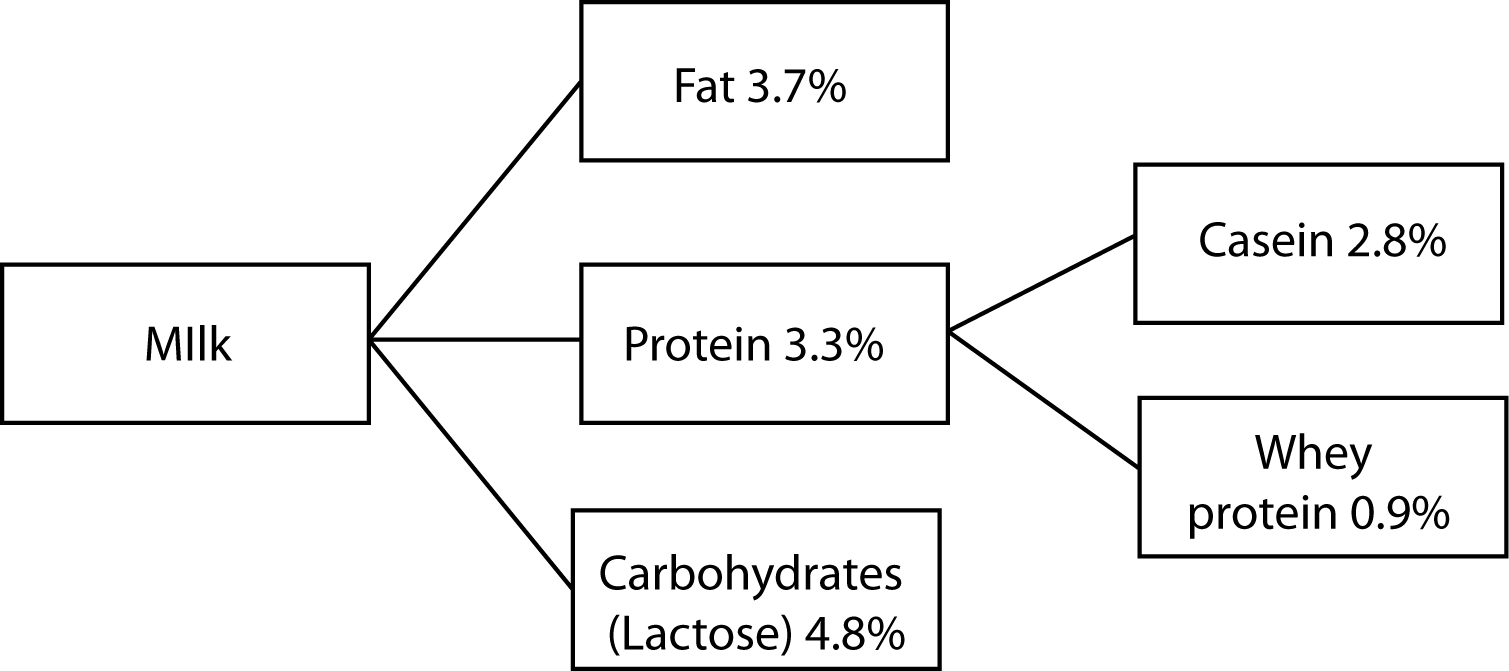
Figure 1. Milk broken down into its molecular constituents. Modified from Properties of Milk and Its Components. [3]
Milk is 3.3% total protein, including all nine essential amino acids; the protein content can be broken down into two main types, casein and serum. Serum, or whey proteins, contain the majority of the essential amino acids. Whey proteins can be coagulated by heat and denaturation of some of these proteins with heat; this gives cooked milk a distinct flavor. Caseins form spherical micelles that are dispersed in the water phase of milk [1]. When steaming milk, the injected air bubbles disrupt the micelles. The protein molecules then encompass the air bubbles, protecting them from bursting and leading to the formation of foam. The take away: The different protein content of different milks consequently affects each milk’s ability to maintain that frothy foam decorating your latte [2]. Whole milk results in a thicker, creamier foam and skim milk results in more foam and larger air bubbles, while almond milk is able to hold a light and long-lasting foam [2].
Table 1: Percent of protein in different types of milk and non-dairy alternative [2]
| Milk | % Protein |
| Skim milk | 3.4 |
| 1% milk | 3.4 |
| 2% milk | 3.3 |
| Whole milk | 3.2 |
| Soy milk | 2.7 |
| Almond milk | 0.4 |
Lactose is the carbohydrate component of milk – a disaccharide composed of D-glucose and D-galactose. There are two forms of lactose present in an equilibrium mixture due to mutarotation, α-lactose and β-lactose. β-lactose is the more stable form, and also the sweeter form of the two [3]. When you steam milk past a temperature of 100 °C, this causes a “browning reaction,” or the Maillard reaction, in which the lactose and milk proteins – mostly caseins – react to form what is know as an Amadori product [4]. The colorless Amadori product is a molecular complex between the lysine residues of protein molecules and the lactose molecules. As the reaction continues with heating, the Amadori product can undergo dehydration and oxidation reactions, or rearrangements that lead to a loss of nutritional value and the formation of unappealing flavor compounds in milk that Sam warned could result from over-steaming.
The last main constituent of milk is the milkfat that exists as globules in the milk. Over 98% of milkfat is made up of fatty acids of different types, including saturated, monounsaturated, and polyunsaturated fatty acids. These fat molecules can also stabilize the formation of foam by surround the air and entrapping it in a bubble. While higher fat content leads to stable foam at temperatures below room temperature, milks with lower fat contents (like skim milk) are better at stabilizing foam at higher temperatures [3]. This could be due to the reduced surface tension of the fat along the air bubble surface that is a result of an increase in fat percentage. Heating up these fat molecules not only affects foam texture; when heated or steamed, the fatty acids also participate in chemical reactions, such as oxidation reactions, that can give rise to an undesirable flavor [5].
For the lactose intolerant and fans of non-dairy alternatives, you may be wondering how lactose free options such as soy or almond milk compare. Their steaming temperatures differ mildly due to their distinct properties – for example, almond milk has a lower protein content (Figure 2). According to the experience and experimentation of expert baristas, certain brands of soy or almond milk can hold a foam better than others; the science underlying this phenomenon still remains to be determined.
Table 2: Ideal steaming temperatures for milk and non-dairy alternatives [6]
| Milk | Soy Milk | Almond Milk | Coconut |
| 150 °F | 140 °F | 130 °F | 160 °F |
The moral of the story is that each component of milk contributes to its ability to froth and foam, and steaming influences each of these components. With this knowledge, you can wisely choose your milk at Starbucks depending upon your foaming desires, or simply download Sam’s app and perfectly steam your milk at home.
References cited
- O’Mahony, F. Milk constituents. Rural dairy technology: Experiences in Ethiopia, Manual No.4; International Livestock Centre for Africa Dairy Technology Unit, 1988.
- Blais, C. The Facts About Milk Foam. Ricardo, [Online] November 2014;
- Chandan, R. Properties of Milk and Its Components. Dairy-Based Ingredients.; Amer Assn Of Cereal Chemists, 1997; pp 1-10.
- van Boekel, M.A.J.S. Effect of heating on Maillard reactions in milk. Food Chemistry. 1998, 62:4, 403-414.
- Walstra, P. Dairy Technology: Principles of Milk Properties and Processes; CRC Press, 2013.
- Dairy Alternatives – Soy, Almond, Coconut, Hazel, Cashew. Espresso Planet. [Online] April 2013;
Christina Jayson is a recent UCLA Biochemistry graduate about to embark on her Ph.D. journey at Harvard.


