Tag Archive for: carbonation

Pop Rocks and Carbonation

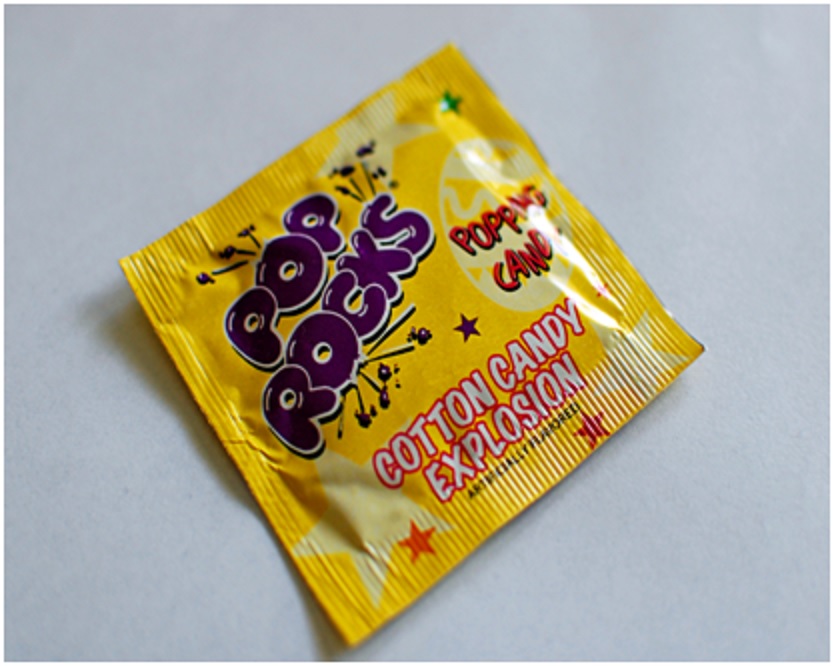
Photo Credit: Jamie (jamiesrabbits/Flickr)

Some might say one of life’s little pleasures is eating candy.  Those who have tried Pop Rocks, however, know that its sugary glory and dare-devilish allure warrant an entirely new adventure.  Although it appears harmless, a handful of Pop Rocks candy will set off a fizzy explosion of sugar crystals and popping noises in your mouth.  But no remorse is needed; Pop Rocks aren’t actually dangerous. (Mythbusters proves your stomach won’t explode.)

How are Pop Rocks made?

Pop Rocks were developed by scientist William A. Mitchell in 1956 with a technique patented in 1961 to create a revolutionary confection which “enclos[es] a gas within a solid matrix” [1, 2].  Essentially, Pop Rocks is made of a typical hard candy sugar solution (sucrose, lactose, corn syrup and flavoring) with the addition of one important ingredient: highly-pressurized carbon dioxide (CO2).

First, the sugar solution is heated and melted to obtain a “fusible sugar”. Pop Rocks, like most other hard candies, uses a sugar solution of sucrose, lactose, and corn syrup, because these ingredients produce candy with low hygroscopicity – which means the candy is less likely to absorb water from the surrounding atmosphere [2]. This ensures that the sweet morsels do not dissolve as easily in a humid environment; they are also less sticky and have a longer shelf life.

Just as CO2 transforms syrupy juice into soda, it will turn ordinary candy into Pop Rocks!  The way this works: CO2 at 600 pounds per square inch (psi) is mixed with the melted sugar until there is about 0.5 to 15 ml of gas per gram of sugar [1, 2].  Note that 600 psi is roughly 7 times greater than the pressure inside a champagne bottle, 20 times greater the pressure in your car tires, and 40 times greater than normal atmospheric pressure at sea level [5, 6].

Photo Credit: Wikipedia

Photo Credit: Spiff (Wikimedia Commons)

Once the CO2 is thoroughly incorporated, a process which takes anywhere from 2-6 minutes [2], the mixture is cooled and the candy hardens. Cooling is done as rapidly as possible to prevent CO2 from diffusing out of the candy, reduce hygroscopicity, and minimize crystallization, a process which makes the candy very fragile. [2]  This causes the Pop Rocks to shatter and gives the candy’s signature appearance, “mini rocks” of sugar crystals.

The result?  Small candy pieces encapsulating bubbles of high-pressure CO2. Lo, the magic of carbonation!

Photo Credit: Wikipedia

Photo Credit: Evan Amos (Wikimedia Commons)

So why do Pop Rocks pop?

When you eat Pop Rocks, the moisture and temperature in your mouth melts the candy.  The subsequent popping sounds are a result of the high-pressure CO2 bubbles being released into atmospheric pressure! But what about the crackling sensations felt in your mouth?  Why do we perceive carbonation as a fizzy, tingling flavor sensation?

In the past few years, scientists have identified that taste receptor cells can actually detect and respond to carbonation.  Specifically, sour-sensing taste receptor cells are activated in response to CO2 and are responsible for the “taste of carbonation” [3].

Photo Credit: Bart Heird (chicagobart/Flickr)

Photo Credit: Bart Heird (chicagobart/Flickr)

The Taste of Carbonation

Sour-sensing taste receptors specifically express a gene which encodes carbonic anhydrase 4, which is an enzyme that catalyzes the conversion of CO2 to bicarbonate ions (HCO3) and free protons (H+).  This enzyme is only attached on the surface of sour-sensing taste receptor cells, so when you eat Pop Rocks or drink carbonated soda, CO2 is broken down and H+ proton byproducts linger outside of the cell. Since sour-sensing taste receptors activate in response to acidic environments. Therefore, they will detect this abundance of free H+ protons and ultimately, detect the taste of carbonation [3].

(A) CO2 is broken down into HCO3- and H+ by the carbonic anhydrase 4 enzyme (B) The abundance of H+ byproducts creates an acidic environment. Through ion channels, the H+ ions enter the sour-taste receptor, which depolarizes the cell and leads to the detection of CO2 .

(A) CO2 is broken down into HCO3 and H+ by the carbonic anhydrase 4 enzyme
(B) The abundance of H+ byproducts creates an acidic environment. Through ion channels, the H+ ions enter the sour-taste receptor, which depolarizes the cell and leads to the detection of CO2 .

However, carbonation doesn’t always taste sour to us because CO2 is detected by multiple somatosensory systems in the body.  Some researchers even suggest that the tingling, burning sensations associated with the perception of carbonation can be caused by CO2 triggering pain receptors [4].

Would this mean our society’s desire for carbonated food and drink has strangely evolved against a natural aversion to experiencing pain?  Personally, I can’t hear over the loud buzzing noises of Pop Rocks in my mouth to find out…and as they say, “no pain, no gain”!

Note: Modified on September 19, 2014
The diagram illustrating taste detection of carbonation has been added in the current post.

References cited

  1. “Why do Pop Rocks pop?”   http://www.poprockscandy.com/history.html. Accessed 23 August 2014.
  2. Leon K, Mitchell W (1961) Gasified confection and method of making the same. US Patent No. US3012893 A.  Available: http://www.google.com/patents/US3012893. Accessed 20 August 2014.
  3. Chandrashekar J, Yarmolinsky D,  von Buchholtz L,  Oka Y, Sly W, et al. (2009) The Taste of Carbonation. Science 326: (5951) 443-445. doi:10.1126/science.1174601.
    Available: http://www.sciencemag.org/content/326/5951/443.full. Accessed 25 August 2014.
  4. Marziali C (2010) “Sparkling Drinks Spark Pain Circuits”. University of Southern California. http://dornsife.usc.edu/news/stories/796/sparkling-drinks-spark-pain-circuits/. Accessed 26 August 2014.
  5. “Champagne FAQ’s” http://www.champagnesabering.com/home.php?id=16. Accessed 16 September 2014.
  6. “How To Check Tire Pressure” http://www.dmv.org/how-to-guides/check-tire-pressure.php. Accessed 16 September 2014.

Eunice LiuAbout the author: Eunice Liu is studying Neuroscience and Linguistics at UCLA. She attributes her love of food science to an obsession with watching bread rise in the oven.

Read more by Eunice Liu


Beer Crust Apple Pie

The Science of Pie – June 1, 2014
Best Scientific Pie
Christina Cheung, Tori Schmitt, and Elliot Cheung (Team Pretty Intense Pie Enthusiasts)

Adding alcohol to a pie crust is a fairly mainstream way of obtaining a nice flaky shelter for a delicious filling within. Vodka is the go-to spirit for crusts, but other beverages have found their way into the realm of apple pies too. One team at the 2014 Scientific Bake-Off, team P.I.E. (Pretty Intense Pie Enthusiasts), was intrigued by the plethora of alcoholic options available to them for pie crusts, and chose to use their scientific prowess to determine the best choice. Two variables guided their experiment: how do carbonation and alcohol concentration affect the flakiness of a pie crust?

Christina Chung presenting team P.I.E's experiment to the judges (Photo Credits: Patrick Tran)

Christina Chung presenting team P.I.E’s experiment to the judges (Photo Credits: Patrick Tran)

Team P.I.E. began by making six experimental crust doughs, each containing either water, beer, stale beer, diluted vodka, regular vodka, and Perrier. To measure flakiness, a quality difficult to quantify, they compared the average height for each baked pie dough to indicate how much the dough has risen during baking. To account for bubbles, height measurements were taken at the center and edges of the crust.

Elliot Cheung hard at work preparing pie (Photo Credit: Patrick Tran)

Elliot Cheung hard at work preparing pie (Photo Credit: Patrick Tran)

These pie researchers calculated the elastic modulus of each crust to further quantify flakiness. Elastic modulus of a substance is the ratio of the stress applied to the resulting strain. This ratio can be thought of as a measure of  stiffness, or in our case, flakiness, as the flakiest crust will break the most easily. 

Pie crusts that utilized both forms of beer had a higher average elastic moduli than crusts with other binding agents.

Pie crusts that utilized both forms of beer had a higher average elastic moduli than crusts with other binding agents.

Pie crusts with Perrier as a binding agent yielded the greatest average heights

Pie crusts with Perrier as a binding agent yielded the greatest average heights

They administered force to their crusts by using a pen to mimic the conditions of fork prongs stabbing a pie crust. Measured values of water balanced atop the pen acted as a weight to provide precise values of force.

Through this extensive research, P.I.E. presented data that showed that a pie crust made with Perrier sparkling water created a significantly thicker crust than one made with any of the other experimental liquids. All the other crusts surprisingly rose to very similar heights.  Since P.I.E had observed similar bubble size and bubble concentration in Perrier and beer, they expected that the regular beer crust would yield similar data to the Perrier crust. However, the significant difference between the measured values  of Perrier and beer imply a confounding factor in the experimental comparison. They speculate that Perrier’s high mineral content could alter the vaporization temperature of the liquid, and thus affect the creation of air bubbles and the dough’s infrastructure.

The dedication to detail and the scientific method paid off for these three scientists, as the panel of esteemed judges awarded them the title of “Best Scientific Pie”. As this was a scientific bake off, that is a pretty high honor to hold. Congratulations to the Pretty Intense Pie Enthusiasts, and we thank you for your deliciously scientific dessert!

Christina Cheung, Tori Schmitt, and Elliot Cheung accept their awards for Best Scientific Pie

Christina Cheung, Tori Schmitt, and Elliot Cheung accept their awards for Best Scientific Pie (Photo Credits: Patrick Tran)

Recipe
Beer Crust Apple Pie

(Makes two full pies)

For crust:

  • 5 cups flour
  • 2 TB sugar
  • 2 t salt
  • 4 sticks chilled butter
  • 1/2 to 1 cup cold beer (we used Blue Moon, but any pale ale works here)

Combine flour, sugar, and salt in a large bowl. (if making full recipe will require a very large bowl) Cut chilled butter into cubes and cut into flour mixture with a fork or pastry cutter.  The flakes can vary in texture but absolutely no butter cubes should remain intact. The mixture will resemble corse sand.  Measure out beer starting at 1/2 cup.  Pour in and incorporate into dough. If dough is still dry, incorporate more beer in until the dough is just moist enough to stick together.  Wrap dough in saran and refrigerate for at least 30 minutes, up to overnight.

For Filling and Assembly:

  • 8 large apples (we used a mixture of granny smith and pink lady)
  • 1 cup sugar
  • 6 tablespoons flour
  • salt and cinnamon to taste
  • Lemon zest (roughly 2 TB)
  • one bottle of beer or hard apple cider
  • egg white to brush the top with
  • 1/2-3/4 cup of shredded gruyere cheese

To prep the filling, core and peel all your apples and soak them in enough beer and/or hard cider to cover for 1-2 hours or until the apples are infused to taste. Pour out liquid and reserve for reduction sauce later. Be sure to remove all the liquid from the bowl and allow the apples to dry for roughly 30-45 minutes.  The apples will look significantly less “wet” after the drying period.  After the apples are dry, combine them with flour, sugar, lemon zest, cinnamon, and salt.  Depending on the sweetness of your hard cider/beer, you may need to adjust the amount of sugar used.

Assembly:

Pre-heat home oven to 500 degrees. Section pre-chilled pie dough into four equal segments and roll out two of the pie dough segments. Place these over buttered glass pie dishes and fold into place. Split filling evenly and pour into each dish. Dot top of apples if additional butter if desired (roughly 1 TB per pie).  Roll out the remaining pie crust into two top pieces.  Sprinkle each top pie with an equal amount of cheese.  Cheese amount will depend on strength and personal preference for cheese.  Flour pin well and lightly roll/ press cheese gently into the crust (dough will be very flaky).  Lay top crust evenly over pie with cheese side facing up. Crimp edges and brush with egg whites.

To bake the pie. place and oven and lower temp to 425 degrees F.  Bake at this temp for 25 minutes at which point, rotate the pie and lower temp to 375 for an additional 30-35 minutes. This will produce a pie with softer apples.   Alternatively the pie can be baked at 375 for a full hour, however the apples may remain more al dente.  (Pie was baked in the second way for competition)


Elsbeth SitesAbout the author: Elsbeth Sites is pursuing her B.S. in Biology at UCLA. Her addiction to the Food Network has developed into a love of learning about the science behind food.

Read more by Elsbeth Sites


The Science of Champagne Bubbles

Photo credit: _FXR/Flickr

Photo credit: _FXR/Flickr

Toast the new year with a bottle of champagne! With its effervescent fizz, golden sparkle, and showy corking, it is the go-to celebratory drink. Read up on champagne making, bubble formation, and the mathematics behind bubble patterns, and get ready to show off some foodie knowledge at this winter’s new year’s party.


How It’s Made

A sparkling wine isn’t champagne unless it comes from its namesake region of France. The Champagne province in the northeast of France boasts ideal soil conditions which contribute to the grape quality, and thus the quality of the beverage that results from champagne winemaking.

Champagne undergoes a two-part fermentation process. The first fermentation results in a flat champagne wine. Next, yeast and sugar are added to this base, and the bottle is sealed. The yeast consume the sugar and produce alcohol along with about 10 grams of CO2 per liter of fluid [1].

Toward the end of production the bottle is opened, whereupon the yeast and about 80% of the CO2 are expelled from the bottle. It may seem that allowing such a large fraction of the CO2 to escape would be undoing the yeast’s hard work, but the remaining 20% in the fluid are enough to make 20 million bubbles in one champagne flute, each no larger than a millimeter in diameter [1]. The bottle is quickly corked once again, and is then ready to be sold.


The Pop

Photo credit: BitHead/Flickr

Photo credit: BitHead/Flickr

At 11:59 on December 31st, many will have a bottle in hand and will be anticipating the bang of the cork shooting out; this is caused by the buildup of pressure inside the bottle. Surprisingly, only 5% of the energy exerted during the bottle opening is the cork’s kinetic energy, that is, the energy of motion that would propel the cork into your uncle’s eye. The remaining 95% of the energy generates the popping sound’s shock wave. This wave causes a mushroom cloud-like pattern of CO2 that is released when the cork pops [3]. The white fog that rises from the bottle after the mushroom cloud is a mist of ethanol and water vapor, triggered by the sudden drop in gas temperature when the bottle pressure is rapidly released Because of the speed at which this occurs, there is no time for the energy transfer—heating—to occur. The result is adiabatic cooling. The gas temperature drops, causing the water vapor in the gas to condense [3].


The Bubbles

Natural Effervescence — Champagne fizz has a rather surprising source. It is caused by the presence of tiny cellulose fibers that cling to the glass by electrostatic forces. The fibers are deposited from the air or that have been left over after wiping the glass with a towel. Each fiber, about 100 micrometers long, develops an internal gas pocket as the glass is filled. These microfiber gas pockets are the bubble formation sites. To form a bubble, dissolved CO2 has to push through liquid molecules held together by very weak but abundant molecular interactions. The CO2 would not have enough energy to do this on its own, but the gas pockets held in the cellulose fibers lower the energy barrier and allow a bubble to form. CO2 continually deposits itself from the champagne into the bubble until it reaches about 10-50 micrometers [1], whereupon its buoyant force is so great that it detaches from the fiber and floats upward. A new bubble forms immediately in its place.

Artificial Nucleation — Because natural effervescence is very random and not easily controlled, glassmakers use a more reproducible way to generate bubbles. Glassmakers use a laser to engrave artificial nucleation sites at the bottom of the glass to make the effervescence pattern pleasing to the eye. They usually create no fewer than 20 scratches to create a ring shape, which produces a consistent column of rising bubbles.


Bubble Patterns

Bubbling patterns actually change over the time that the champagne is within the glass. The bubbles start out as strings that rise in pairs, then gradually transition to bubbles in groups of threes, and finally settle down in a clockwork pattern of regularly spaced individual bubbles. A team of physicists in the Champagne region of France have performed extensive research to figure out the science behind champagne fizz and the interesting patterns the bubble strings form.

The patterns are determined by the vibration rate of the gas trapped at the nucleation point and the growth rate of the bubbles outside. These factors are determined by  atmospheric pressure on the surface of the champagne, temperature, and the size of the nucleation point in the glass, among other factors. The Champagne team has arrived upon a complex equation to explain the differential patterns of bubble streams by relating bubble radius, oscillation frequency of the gas pocket, and the time interval between two successive bubbles [2]

R(Ti + 1) = Ro + Ecos(2πωFbTi + 1)

where Ro is the radius of the bubble just before release, and Ti is the time interval between two successive bubbles, ω is the ratio between the oscillation frequencies of the gas pocket and the bubble (Fb), and E is related to the interactions between the two systems [2].

Now that some of the mystery behind the sparkle and pop of champagne has been explained through science, opportunities to impress friends and strike up conversation present themselves at the next big occasion. Break out a timer and graph paper; observe one nucleation point on a glass and measure the transition time from two to three bubble patterns. Someone is bound to ask what the stop watch is for.


References

  1. “Bubbles and Flow Patterns in Champagne.”  American Scientist. N.p., n.d. Web. 19 Dec. 2013.
  2. Liger-Belair, Gerard. “Period Adding Route in Sparkling Bubbles.” Physical Review 72 (2005): n. pag. Web.
  3. Boyle, Alan. “The Science of Champagne Bubbles Up for Again For News Year’s Eve.” NBC News. N.p., 31 Dec. 2012.

Elsbeth SitesAbout the author: Elsbeth Sites is pursuing her B.S. in Biology at UCLA. Her addiction to the Food Network has developed into a love of learning about the science behind food.

Read more by Elsbeth Sites